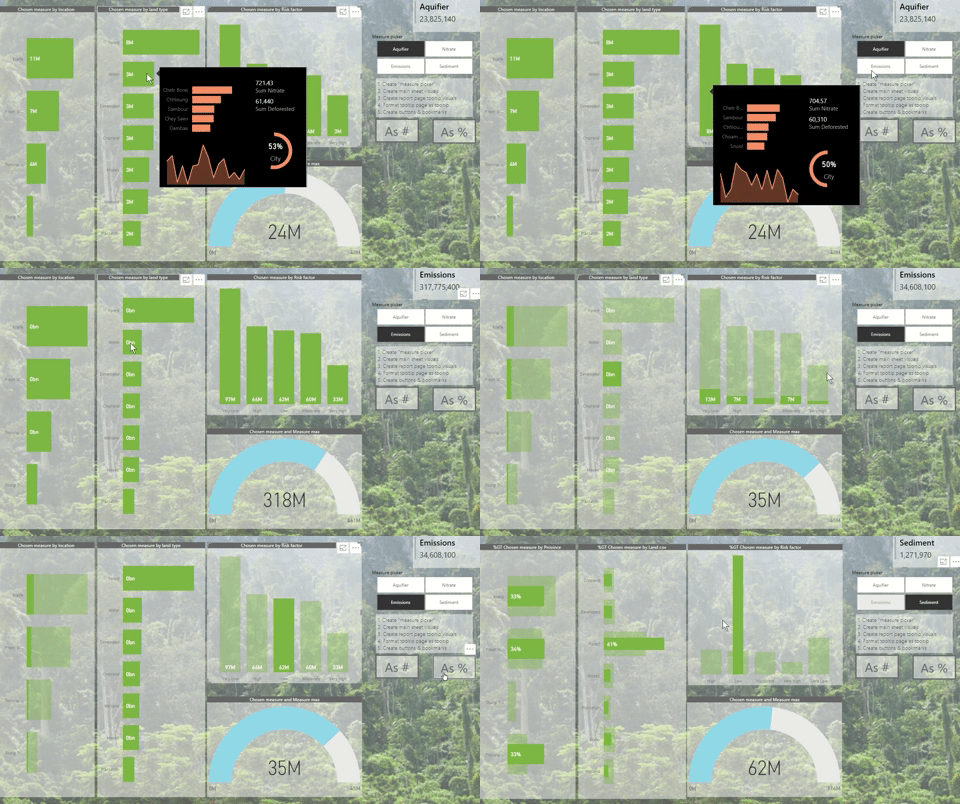
This PowerBI interactive report allows users to get many different views from one page. Hover over data points for more details and click on chart elements or selection boxes to interact with other charts on the page. Scroll down to view instructions via image, video or a moving GIF image showing how to click around.
Note: If you see the PowerBI logo flashing below, the report has not loaded yet.
CLICK HERE FOR MOBILE VIEW and rotate to landscape.
Note: If you see the PowerBI logo flashing below, the report has not loaded yet.
CLICK HERE FOR MOBILE VIEW and rotate to landscape.
|
|
Terminology used
Trader: Merchant at market who sells produce and buys from farmers or other traders, and sells Shortfall: Calculated demand less calculated supply in Kg/day (using assumptions) Season: A 6 month period, wet season is December to May, dry is June to November Market: A place where traders and consumers meet to sell vegetables & other goods, there may be zero, one or many markets in one district. Supplier/Farmer: The main CHAIN target. Counted as a member of a farmer group regardless of household. Farmer group/FG: A set of farmers collaborating in vegetable growing, grouped by geographical area. Partner:An organisation helping CHAIN to achieve its targets. See "Terminology" page for more. |
|
CHAIN B2B video Sep 18 from David Benaim on Vimeo. |


